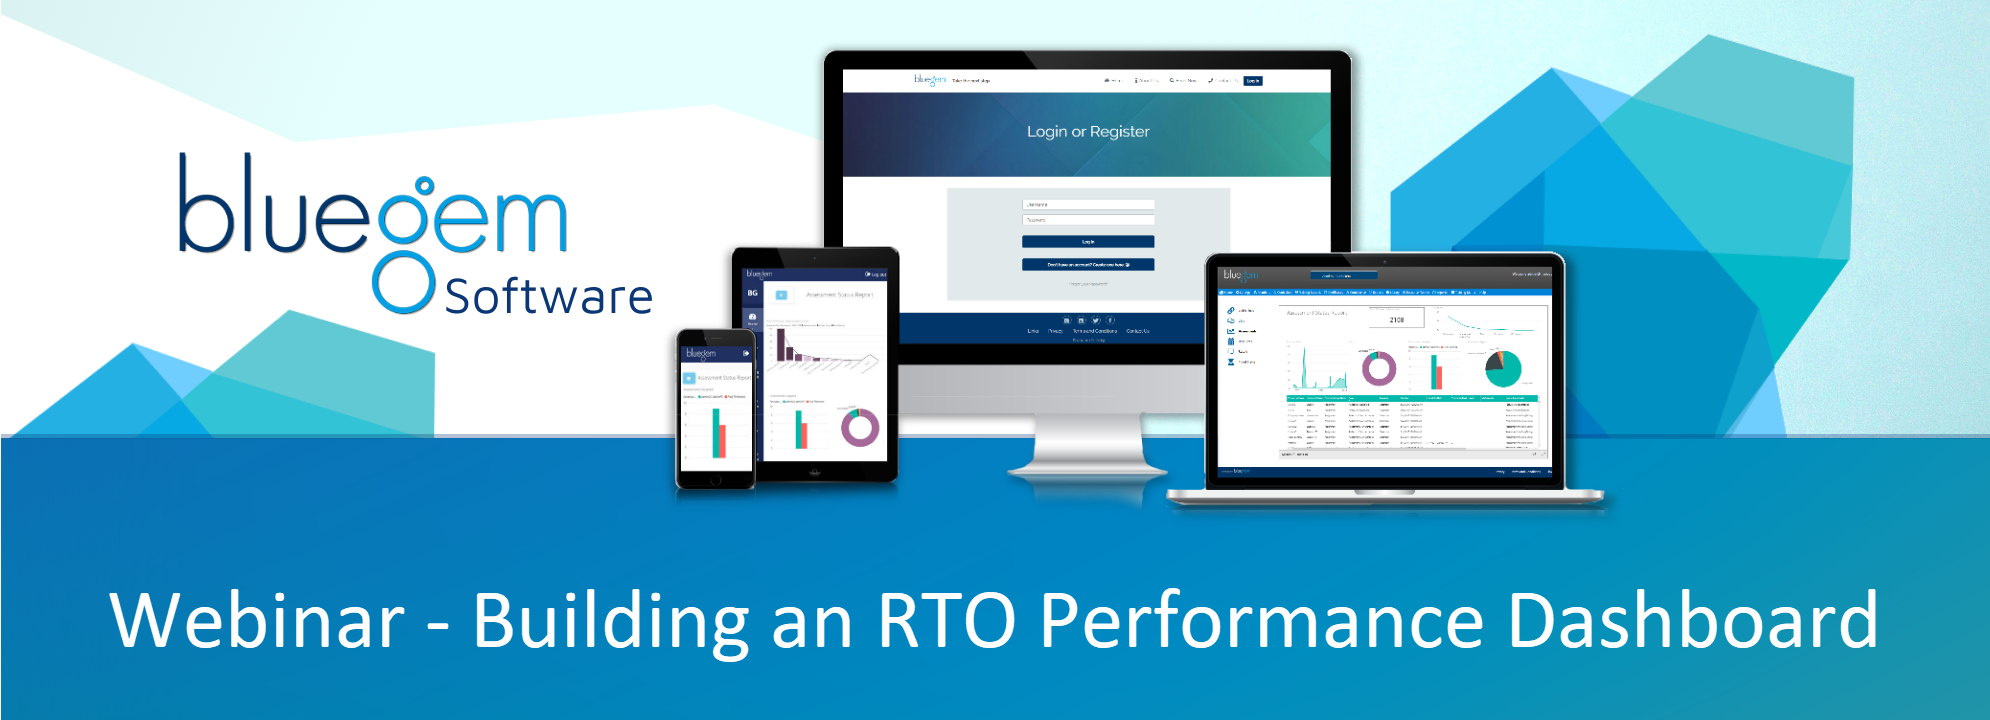
We've all heard Peter Drucker's famous saying "if you can't measure it, you can't improve it". As an RTO you're expected to track and measure all sorts of stats and numbers for the Government. But what about your own stats? When will you find the time to measure and improve on the numbers that matter to your RTO business?
In this webinar we'll demonstrate the key ways to track the numbers that tell you where to apply that apply that all important drop of lubricating oil, so that your business can operate freely and profitably.
There's no better time to be woring on your business
If there's one thing we could all be doing during the COVID 19 lockdow, it's priming the pumps for a stella recovery. That starts with regularly analysing real and meaning ful data. And there's no better way to do that than to have a dashboard displaying up-to-date data.
In this presentation Bruno Cozzi and Tim Dean will offer the benefit of their combined years of technical and financial repoting experience. To give you an insight into how to build the tools you need for better tracking.
What you'll learn
This complimentary presentation will help you:
- Identify the metrics that matter
- Capture your daily data
- Visualise your data in menaing ful graphs and tables .
- Share it with your colleagues
- Identify and act on areas for ongoing improvement
The reasons for our success are the benefits we deliver to our customers:
Demo RTO Dashboard
About the demo RTO Dashboard
The demo is a sample dashboard built in Power BI and integrated in the Bluegem Admin Portal. The example RTO has significant opportunity, but has so far been able to capitalise dure to poor measurment and data management. The example presents the compay from 3 views: Completions, Results and Financial record. The dashboard could equally be built in Excel or many other reporting tools.
If you'd like to learn more contact us at Bluegem or or click the image to register for our forthnighly webinar series on these and other related topics.
|
Powerful API Data. How to get the data you need for outstading, up-to-date reporting.. |
Render to Excel or Power BI. Formatting your data in meaningful dashboard reports and graphs.. |
Integrate with Office 365. Got Office 365? Integrate to using the power of Office 365 production suite. |
|
Share with your team. Build dashboard and report libraries that your colleagues can subscribe to... |
Learn and make decisions Your business is about training and development. Here's where you can capitalise. |
Improve your bottom line. Nothing happens without ACTION developyour improvement Action Plan. |
